Summer Working Connections by the numbers
Every Summer Working Connections attendee is required to take three surveys during the five-day training event. A short survey on Monday afternoon helps with any necessary course corrections. The two longer, more comprehensive surveys at the end of the training event on Friday afternoon provide an overall look at the program’s success. Together, these surveys provide the National Convergence Technology Center (CTC) a detailed look at the effectiveness of the program from a number of angles, as well as provide a platform to ask this group of IT educators other questions of interest.
The National CTC has just started to mine the survey data, but below are some interesting initial results.
High-quality IT training
Participants feel that Summer Working Connections delivers what it promises: high-quality IT training that showcases “best practices.” See below.
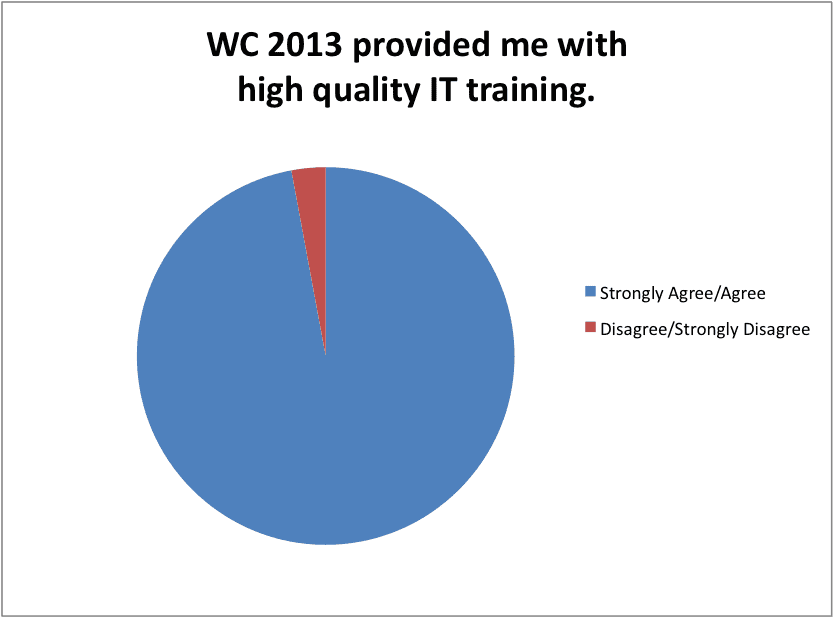

Almost 100% of all respondents “strongly agreed” or “agreed” to the statements “I will use what I learned when teaching the next academic year” and “I would recommend Working Connections to a colleague.”
Anecdotally, here’s a collection of quotes from respondents answering the question “What features did you like best about Working Connections?”:
“Hands on learning – combination of lecture and practice.”
“Exchange of ideas with other instructors.”
“Good coordination and planned schedule.”
“Everything.”
“Helpful staff, organized program, great learning.”
“Intense learning environment.”
“Networking with colleagues.”
“The cutting-edge technology.”
“The training was exactly what I needed.”
“I don’t know if I can pick just one thing.”
New Attendees
While there is a die-hard group of Working Connections “regulars,” more than half of the Summer Working Connection participants have attended three or fewer events. And for half of those, 2013 was their first Working Connections event.

Looked at another way:
1-3 events, 62 (60.19%)
4-6 events, 21 (20.39%)
7+ events, 20 (19.42%)
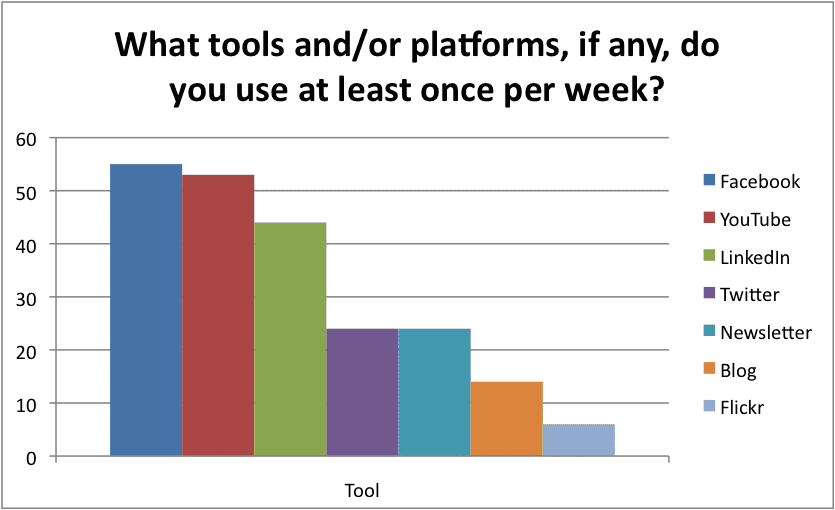
Educators on Social Media
For our cross-section of IT educators, Facebook, YouTube, and LinkedIn reign supreme in the social media space.
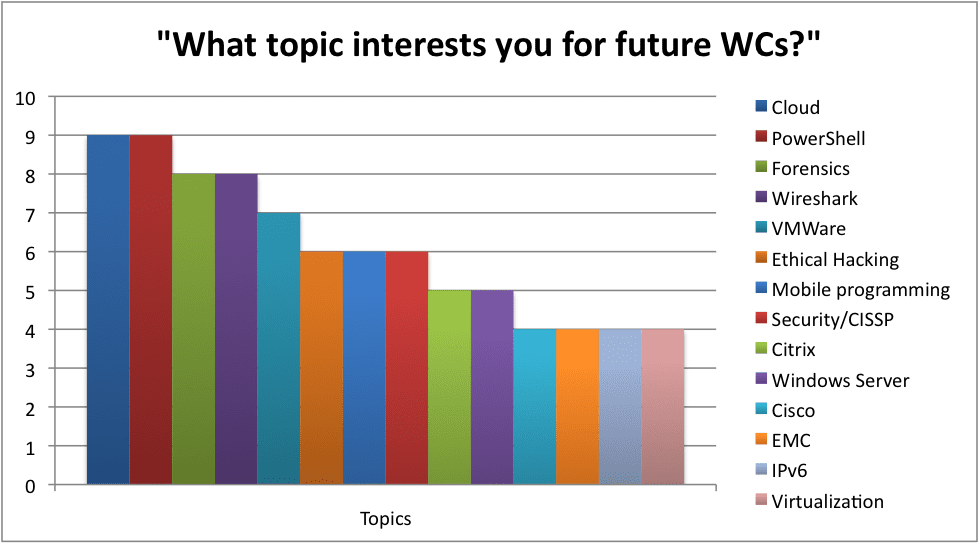
Looking Ahead
The survey also tried to look ahead for future events. Participants were asked to name topics that might interest them for future Working Connections events, which will help guide the content for Winter 2013 and Summer 2014. See below.
Working Connection surveys are works-in-progress. The National CTC is always looking for ways to sharpen and strengthen its evaluation tools. A great resource for us has been the tools and webinars provided by EvaluATE.
What do you think of our survey questions and results? What tools do you use to gauge whether your events were a success?